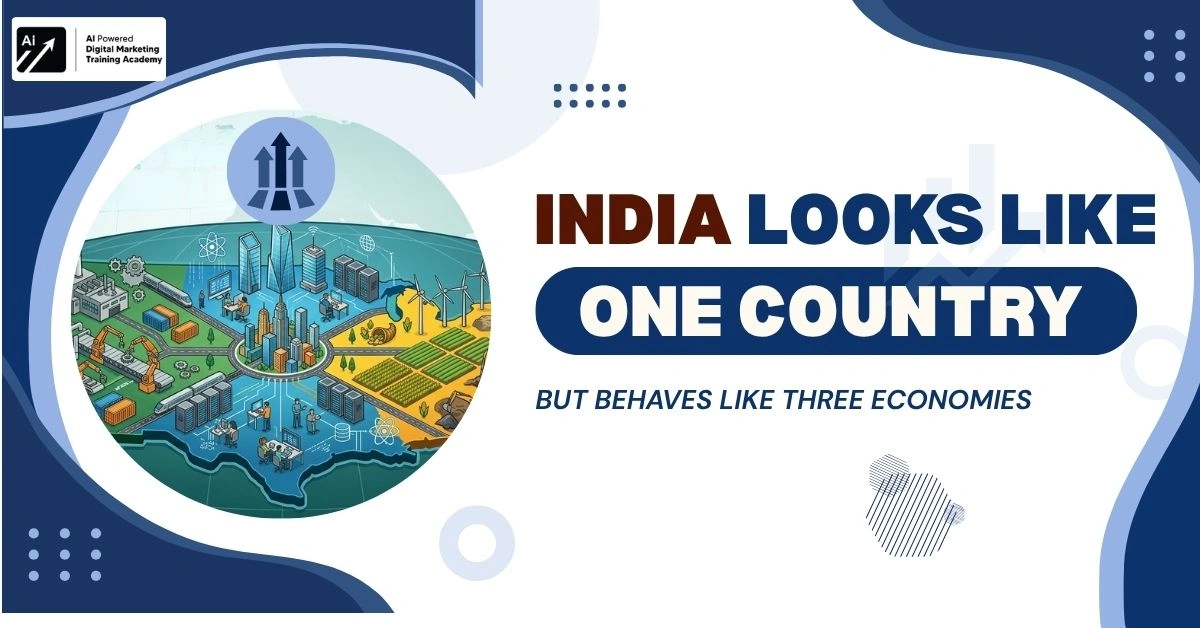

Even at a glance, you would be forgiven for thinking India was one market. One country. One population. One growth story. But that view breaks down quickly when you look closer. The reality is not one economy moving together. It is three different India’s moving at very different speeds. This is the Three India’s economy. India does not behave like a single economy. It behaves like three distinct economies.
Income levels vary widely. Spending patterns are not uniform. What one group considers basic, another group sees as a luxury. This creates a structural divide. India does not behave like one economy. It behaves like three different economies operating at the same time. Understanding this difference is not optional.
It is the difference between:
- Building something that scales
- And building something that fails despite demand
What Does “Three Indias” Actually Mean?
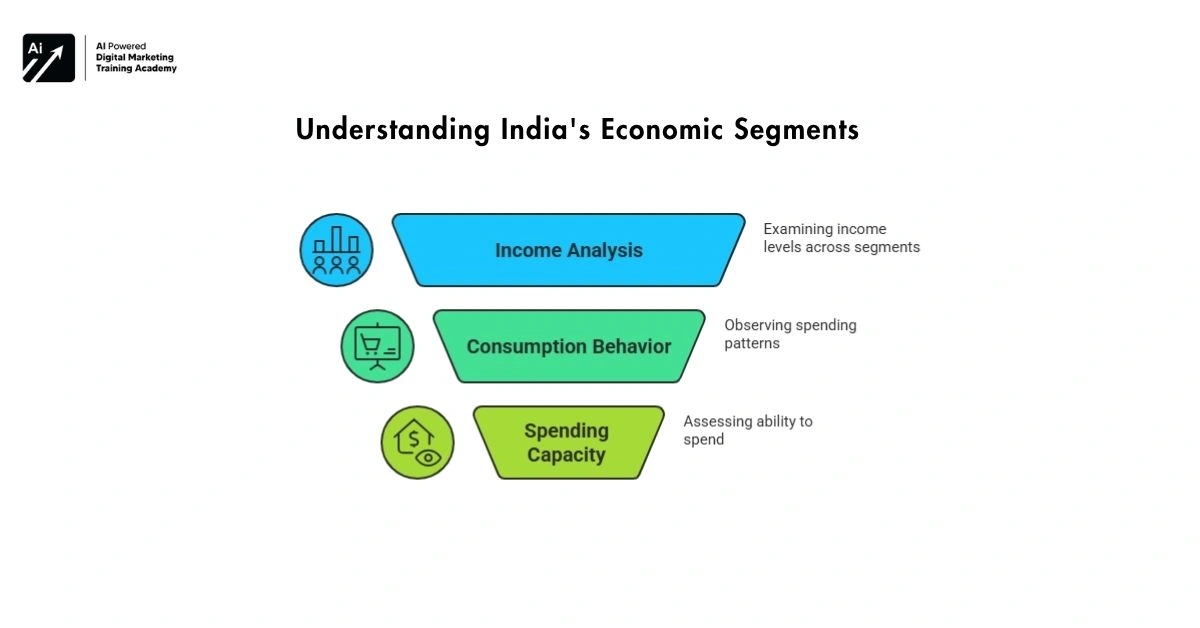
The idea is simple. India can be broadly divided into three economic segments based on income, consumption patterns, and paying capacity. This is the foundation of the Three India’s economy.
- Income
- Consumption behavior
- Spending capacity
These are not official categories. They are functional groupings to understand how the economy actually works.




India 1: The Consuming Engine
Who They Are
- Top ~10% of the population
- Approximately 30 million households.
- About 140 million people.
Income Profile
Around ₹12.4 lakh per year (approx.)
How They Spend
This group drives:
- They comprise most of discretionary spending
- Premium consumption
They buy:
- Smartphones, cars, travel
- Subscriptions, premium services
- Lifestyle products
Why This Group Matters
Most startups target this segment because:
- They pay and upgrade
- They adopt new products quickly
India’s visible growth story is largely driven by this group.
Hidden Reality
This group is:
- Growing deeper (more spending per person)
- Not growing wide (not enough new entrants)
- This limits long-term market expansion.
India 2: The Aspiring Majority
Who They Are
- Approximately 70 million households.
- Approximately 300 million people.
Income Profile
Around₹2.5 lakh per year
How They Spend
This group:
- Consumes actively
- But spends carefully
They prefer:
- Value-for-money products
- Small-ticket transactions
What Works Here
- UPI payments
- OTT subscriptions (shared accounts)
- Gaming and microtransactions
- Budget smartphones
- Edtech (with pricing pressure)
Key Behavior Pattern
They are:
- Willing users
- Reluctant payers
This is where many startups struggle.
Why Businesses Fail Here
Companies assume:
- Usage = revenue
But reality:
- High engagement does not guarantee high payment
- Monetization is the real challenge.
India 3: The Bottom Layer (Often Misunderstood)
Who They Are
- Around 200+ million households
- Close to 1 billion people
Income Profile
Around ₹83,000 per year
Spending Reality
This group:
- Spends mostly on essentials
- Has very limited discretionary income
Important Correction
Calling this group a “non-market” is inaccurate.
They are:
- Price-sensitive market
- A high-volume, low-margin segment
Where This Segment Is Active
- FMCG products (small packs)
- Telecom (low-cost data)
- Government schemes
- Essential services
The Real Constraint
- The problem is not demand.
- It is purchasing power.
The Core Insight: India’s Challenge Is Not Demand, It Is Distribution
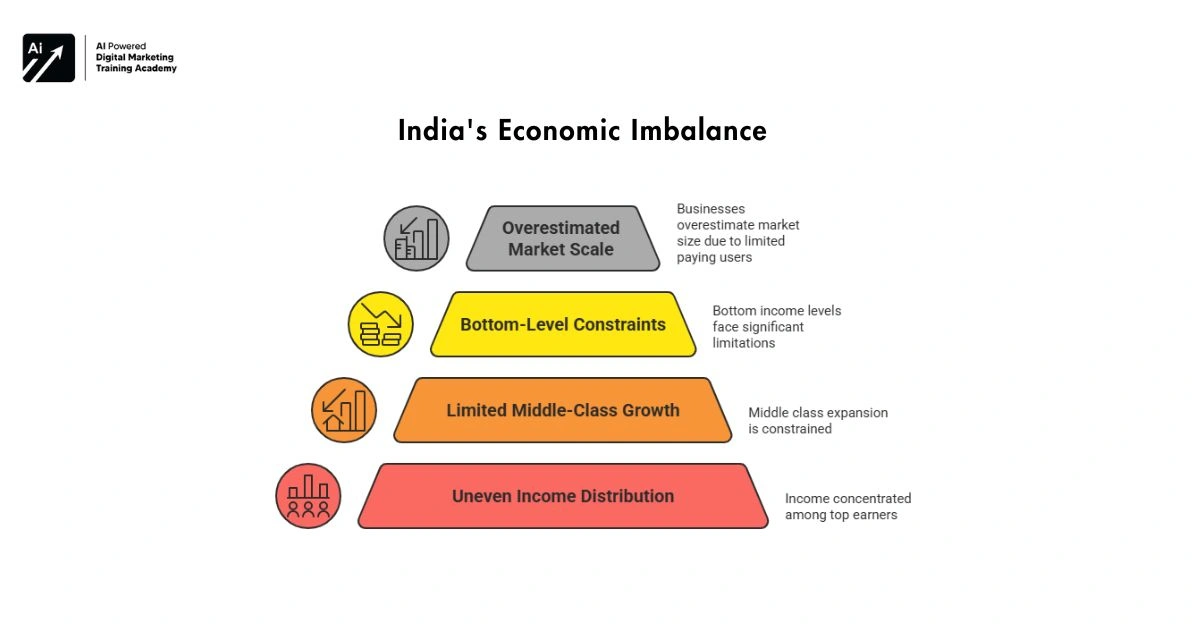
What This Creates
- Strong growth at the top
- Limited expansion in the middle
- Constraint at the bottom
Result
- Markets look large
- But actual paying users are limited
This is why many businesses overestimate scale.
Why Startups Get This Wrong
Confusing Users With Customers
- Downloads ≠ revenue
- Engagement ≠ willingness to pay
Building Only for India 1
- Works initially
- But limits scale
Mispricing for India 2
- Too expensive → no adoption
- Too cheap → no profitability
Second-Order Effects
1. Credit Expansion
India 2 is growing through credit, not just income. This can increase consumption, but only temporarily. This is a key dynamic within the Three India’s economy.
2. Digital Infrastructure
UPI, cheap data and also increased access
But:
Access does not equal purchasing power
3. Government Transfers
- Subsidies and welfare schemes
- Support India 3
This stabilizes demand but does not create discretionary spending.
What This Means for India’s Growth Story
India’s growth is real, but uneven.
- India 1 drives visible growth
- India 2 drives scale potential
- India 3 defines long-term opportunity
The Key Limitation
Growth today is:
- Concentrated
- Not evenly distributed
The Real Question
Not:
“Is India growing?”
But:
“Who is actually growing within India?”
What Businesses Should Do Differently
1. Identify Your Target India Clearly
Do not try to serve all three
2. Align Pricing With Reality
- India 1 → premium
- India 2 → value-driven
- India 3 → cost-sensitive
3. Build for Behavior, Not Just Income
Payment habits matter more than income alone
Urban vs Rural: Why the “Three Indias” Are Not Evenly Spread
The three segments are not distributed equally across geography.
Urban India
- Dominated by India 1 and parts of India 2
- Higher income concentration
- Faster adoption of new products
Rural India
- Largely India 2 and India 3
- Income is irregular and seasonal
Spending depends on agriculture cycles, wages, and government support
Why This Matters
A product that works in urban India may fail in rural areas because:
- Income timing is different
- Spending priorities are different
- Geography changes behavior, not just income.
The Role of Pricing Strategy Across the Three Indias
Pricing is not just about affordability. It is about perceived value vs actual ability to pay.
India 1
Price is less sensitive and brand and convenience matter more
India 2
Extremely price-sensitive
Looks for:
- Discounts
- Bundles
- Shared usage
India 3
Purchases are:
- Small-ticket
- Frequent
- Need-based
Key Insight
This product cannot be priced the same way for all 3 different segments. One pricing strategy across India = guaranteed failure.
Consumption vs Ownership: A Critical Difference
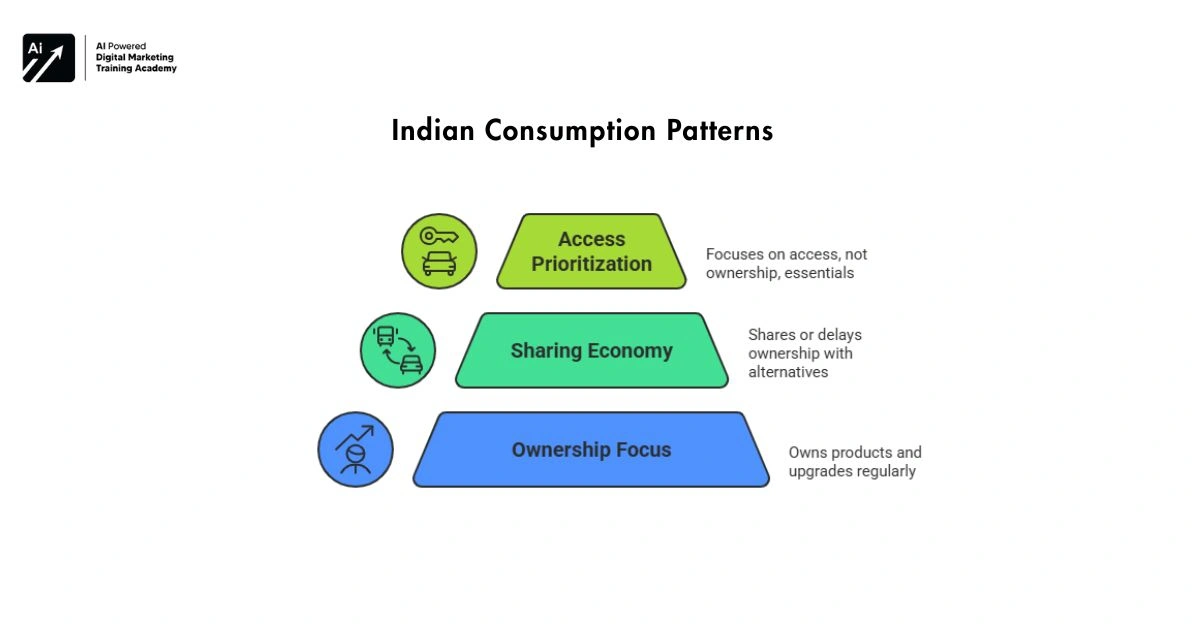
Most analysis focuses on what people buy. But the real difference is in ownership patterns.
India 1
- Owns products
- Upgrades regularly
India 2
Shares or delays ownership which uses alternatives
Examples:
- Shared OTT accounts
- Second-hand products
- EMI-based purchases
India 3
- Focuses on access.
- Not ownership
- Prioritizes essentials
Why This Matters
High usage does not always mean high ownership.
This affects:
- Revenue models
- Product design
- Long-term profitability
Future Shift: Can India 2 Become the True Growth Engine?
Most long-term growth depends on India 2.
Why India 2 Matters Most
- Large population
- Rising aspirations
- Increasing digital access
What Can Drive Growth
- Income growth
- Job creation
- Access to credit
The Constraint
If income growth does not match aspirations:
- Consumption will rely on credit
- Financial stress may increase
Key Insight
India’s future growth depends on:
- Whether India 2 can move towards India 1
- Not merely in terms of quantity but also in terms of spending capacity.
Why high GDP growth does not necessarily translate into inclusive growth
India frequently puts up impressive GDP figures. That looks to be indicative of an all-around expansion in the economy, but GDP growth figures reveal nothing about who is reaping the benefits.
What GDP Measures
GDP tracks:
- Total economic output
- Overall production and spending
But it does NOT show:
- Income distribution
- Who is actually earning more
- Who is left behind
What Happens in Reality
Growth can be driven mainly by:
- India 1 increasing spending
- Certain sectors expanding rapidly
While:
- India 2 sees limited income growth
- India 3 sees little change in purchasing power
The Result
You get a situation where:
- Headline growth looks strong
- But mass consumption does not expand equally
This creates a disconnect between:
- Economic data
- Ground reality
Why This Matters for Businesses and Investors
If you rely only on GDP growth:
- You may overestimate market size
- May assume demand where it does not exist
Final Thoughts
India is not one uniform market and it is a layered system where:
- Income
- Access
- Spending behavior
- All differ significantly.
Understanding India does not mean understanding a single number like GDP. It means understanding how different groups:
- Earn
- Spend